Sketch rows
As for the case of estimating the total number of packets, we will consider the same three different factors to make sure the results are consistent on the case of estimating the proportion of dropped packets.
Average function
In the case of estimating the total number of packets, we can see that all the estimators are fairly centered at 0. The advantage in this case of using the mean is its smaller deviation.
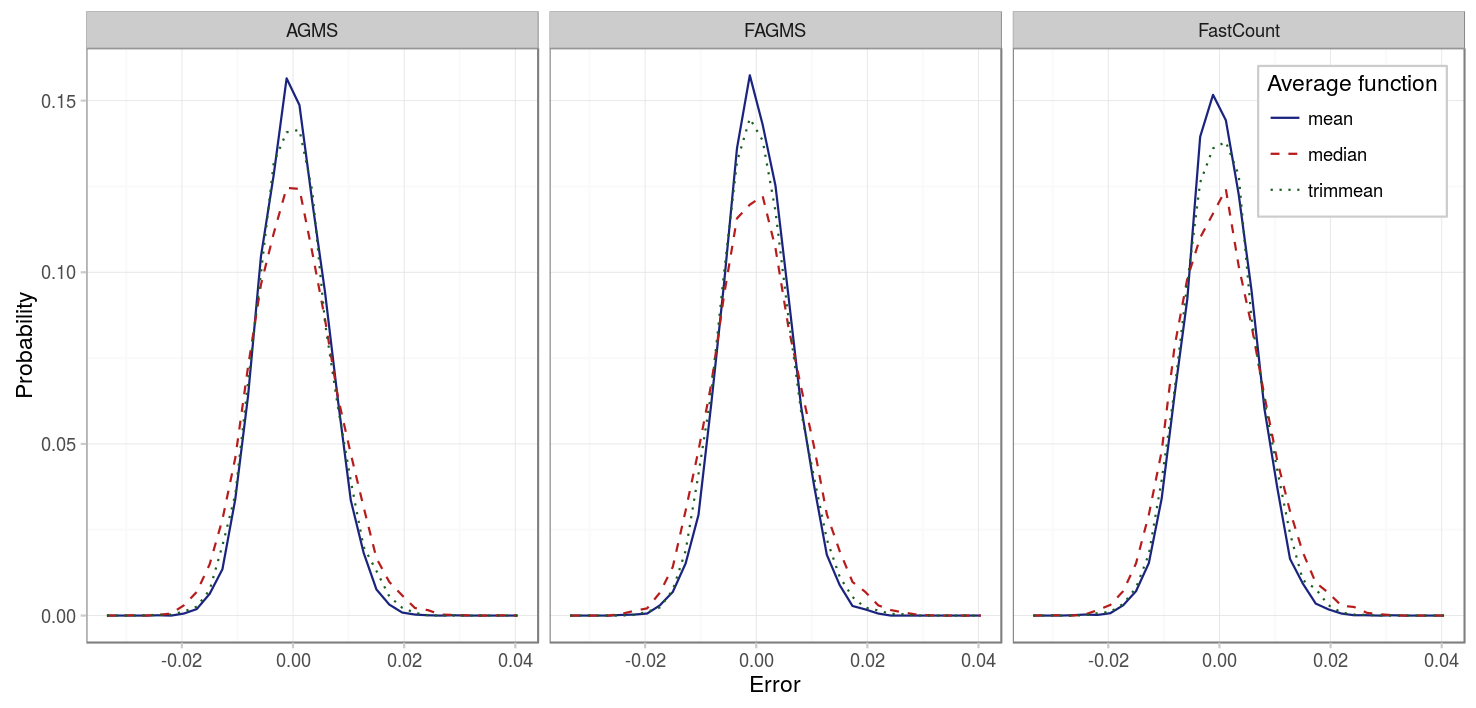
| Parameter | Value |
|---|---|
| Packets | 1000 |
| Drop probability | 10% |
| Columns | 32 |
| Rows | 32 |
| Digest size | 32 |
| Hash function | default |
| Xi function | default |
| Pcap | CAIDA |
| Average function | {mean, median, trimmean} |
Number of rows
On the other hand, the effect of the number of rows is the same: the standard error reduces approximately with the inverse of the square of the number of rows.
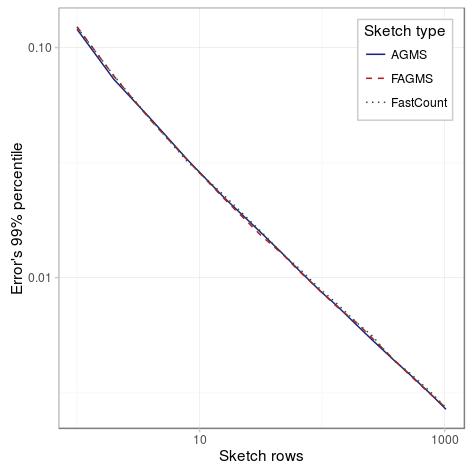
| Parameter | Value |
|---|---|
| Packets | 1000 |
| Drop probability | 10% |
| Columns | 32 |
| Rows | {1,2,4,8,16,32,48,64,96,128,192,256,384,512,768,1024} |
| Digest size | 32 |
| Hash function | default |
| Xi function | default |
| Pcap | CAIDA |
| Average function | mean |
Aspect ratio
The same happens with the aspect ratio: the FastCount is the sketch most affected by the aspect ratio, it is recommended to have at least as many columns as rows. And again, when there aren’t much packets the results for FastCount and Fast-AGMS depend on the specific value of the percentile for the case of little rows.
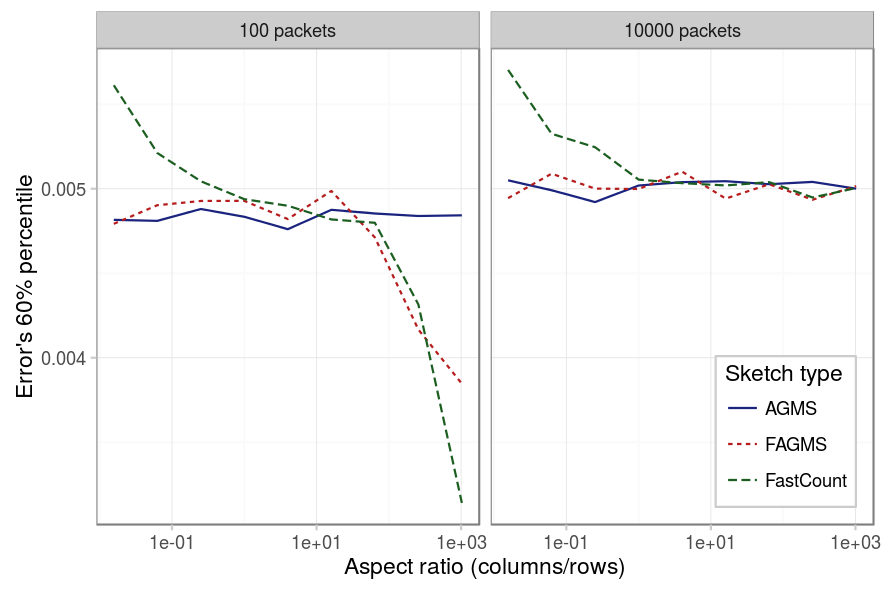
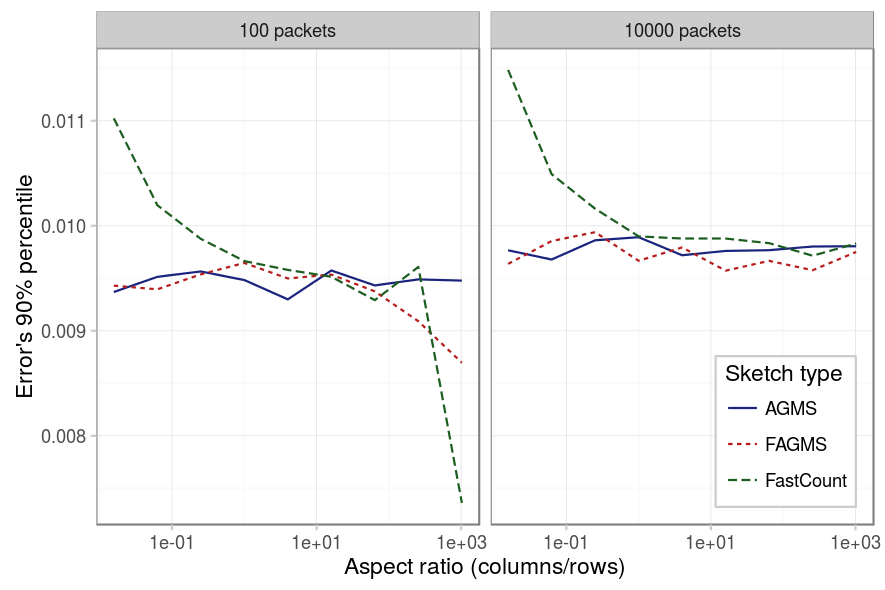
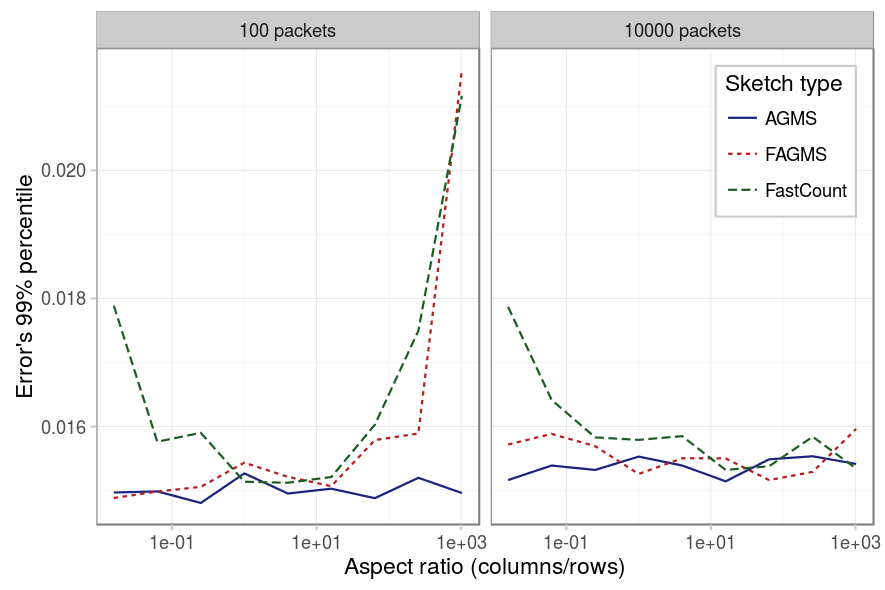
| Parameter | Value |
|---|---|
| Packets | {100, 10000} . |
| Drop probability | 10% |
| Columns | {8,16,32,64,128,256,512,1024} |
| Rows | 1024/columns |
| Digest size | 32 |
| Hash function | default |
| Xi function | default |
| Pcap | CAIDA-no dups |
| Average function | mean |